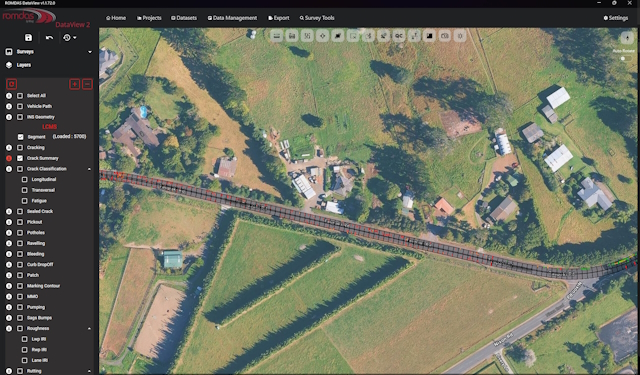
Dataview 2
Office Post-processing software
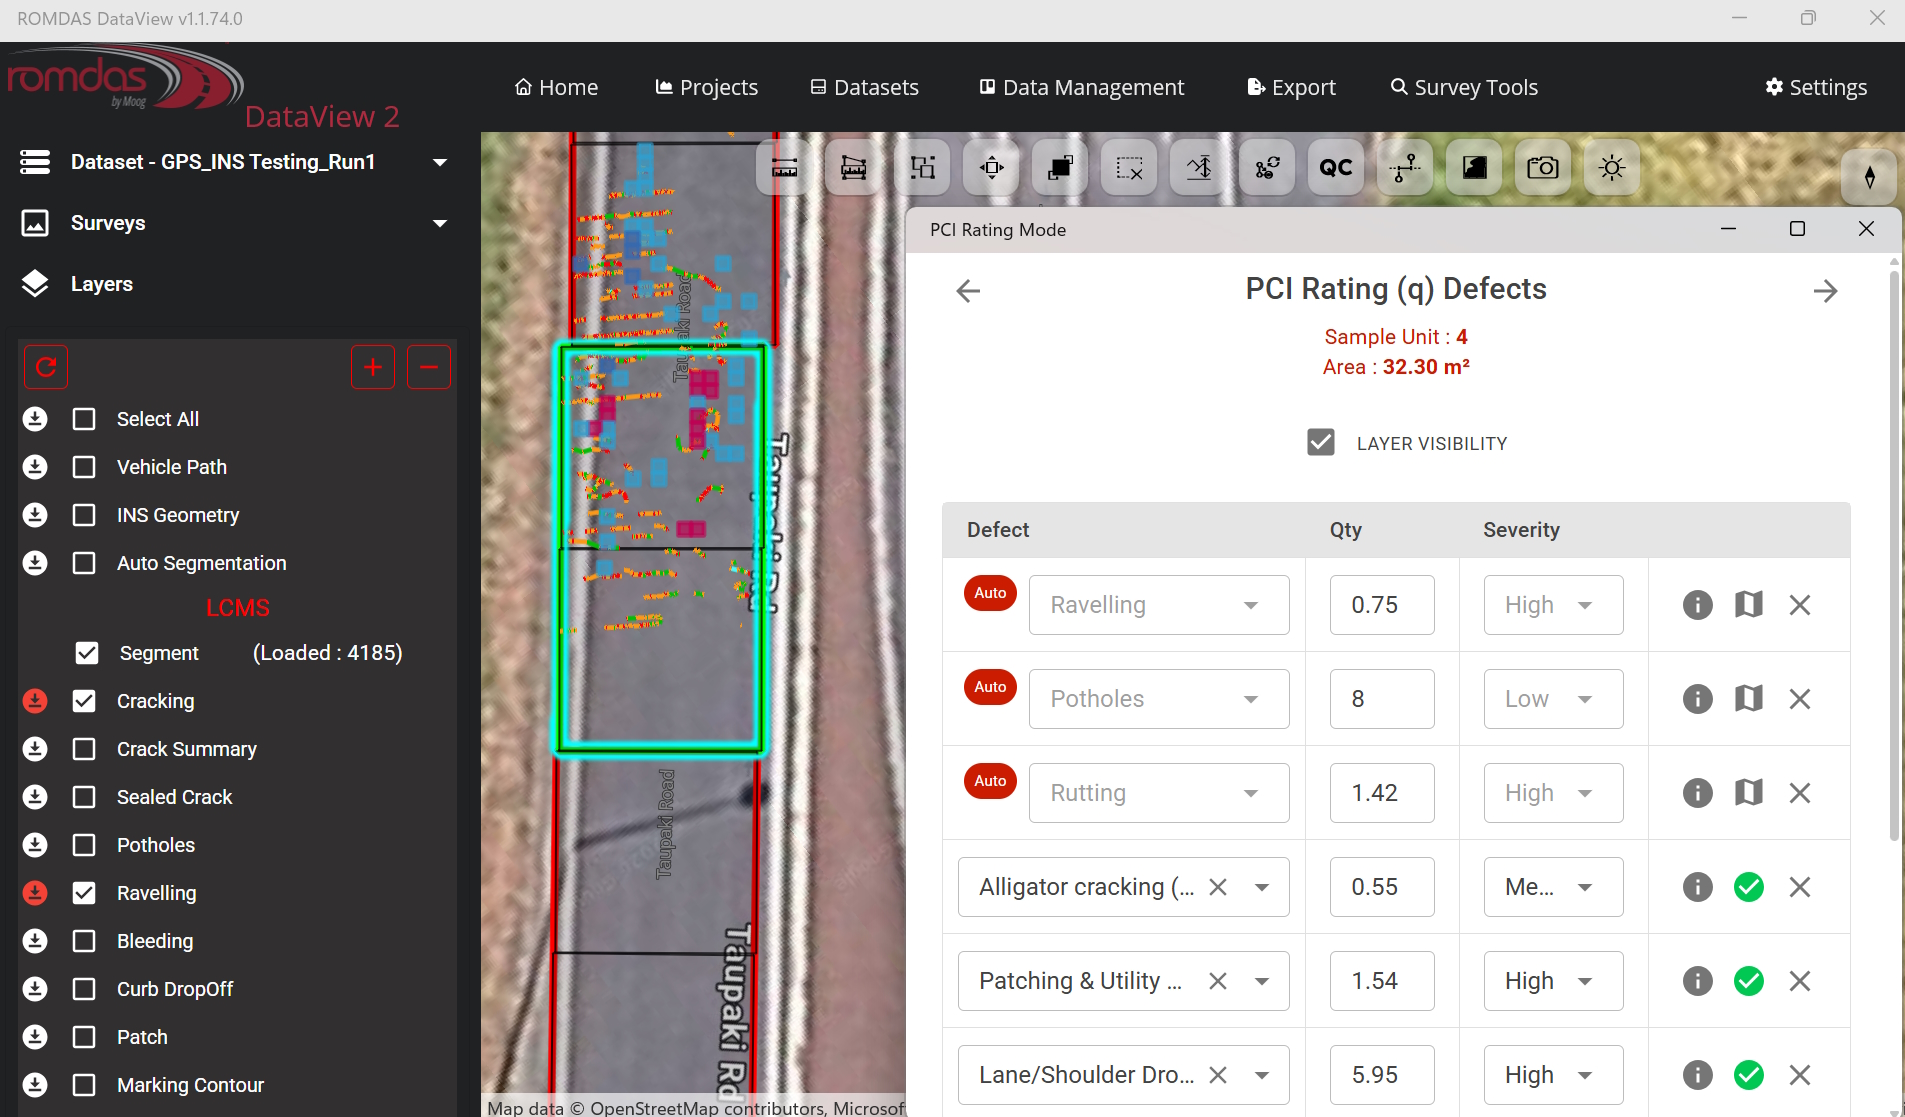
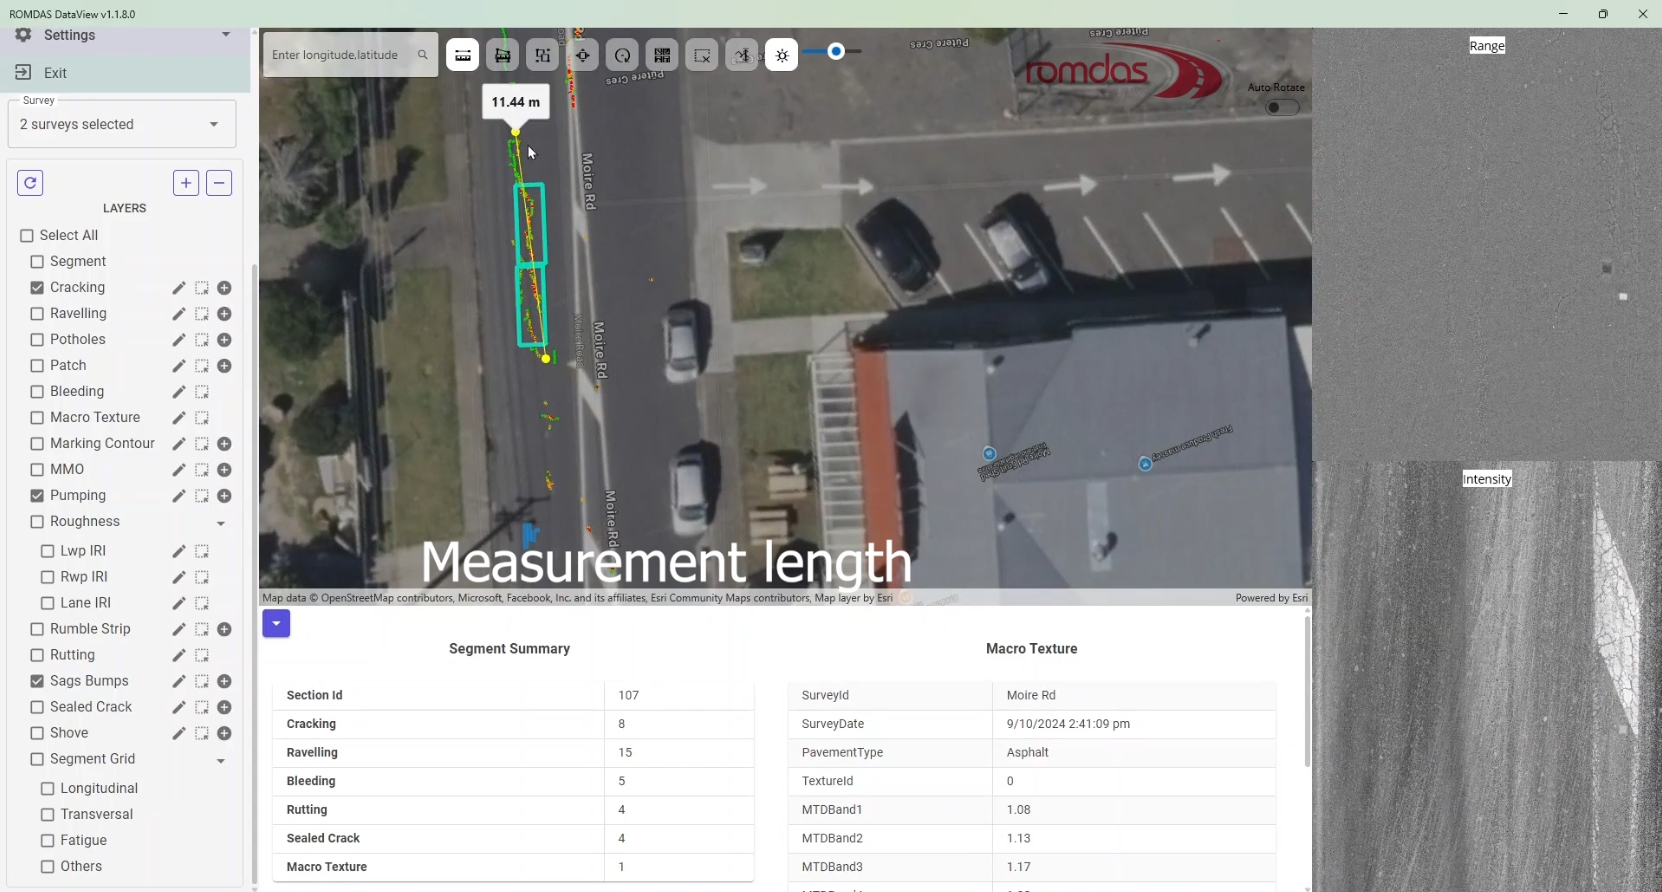
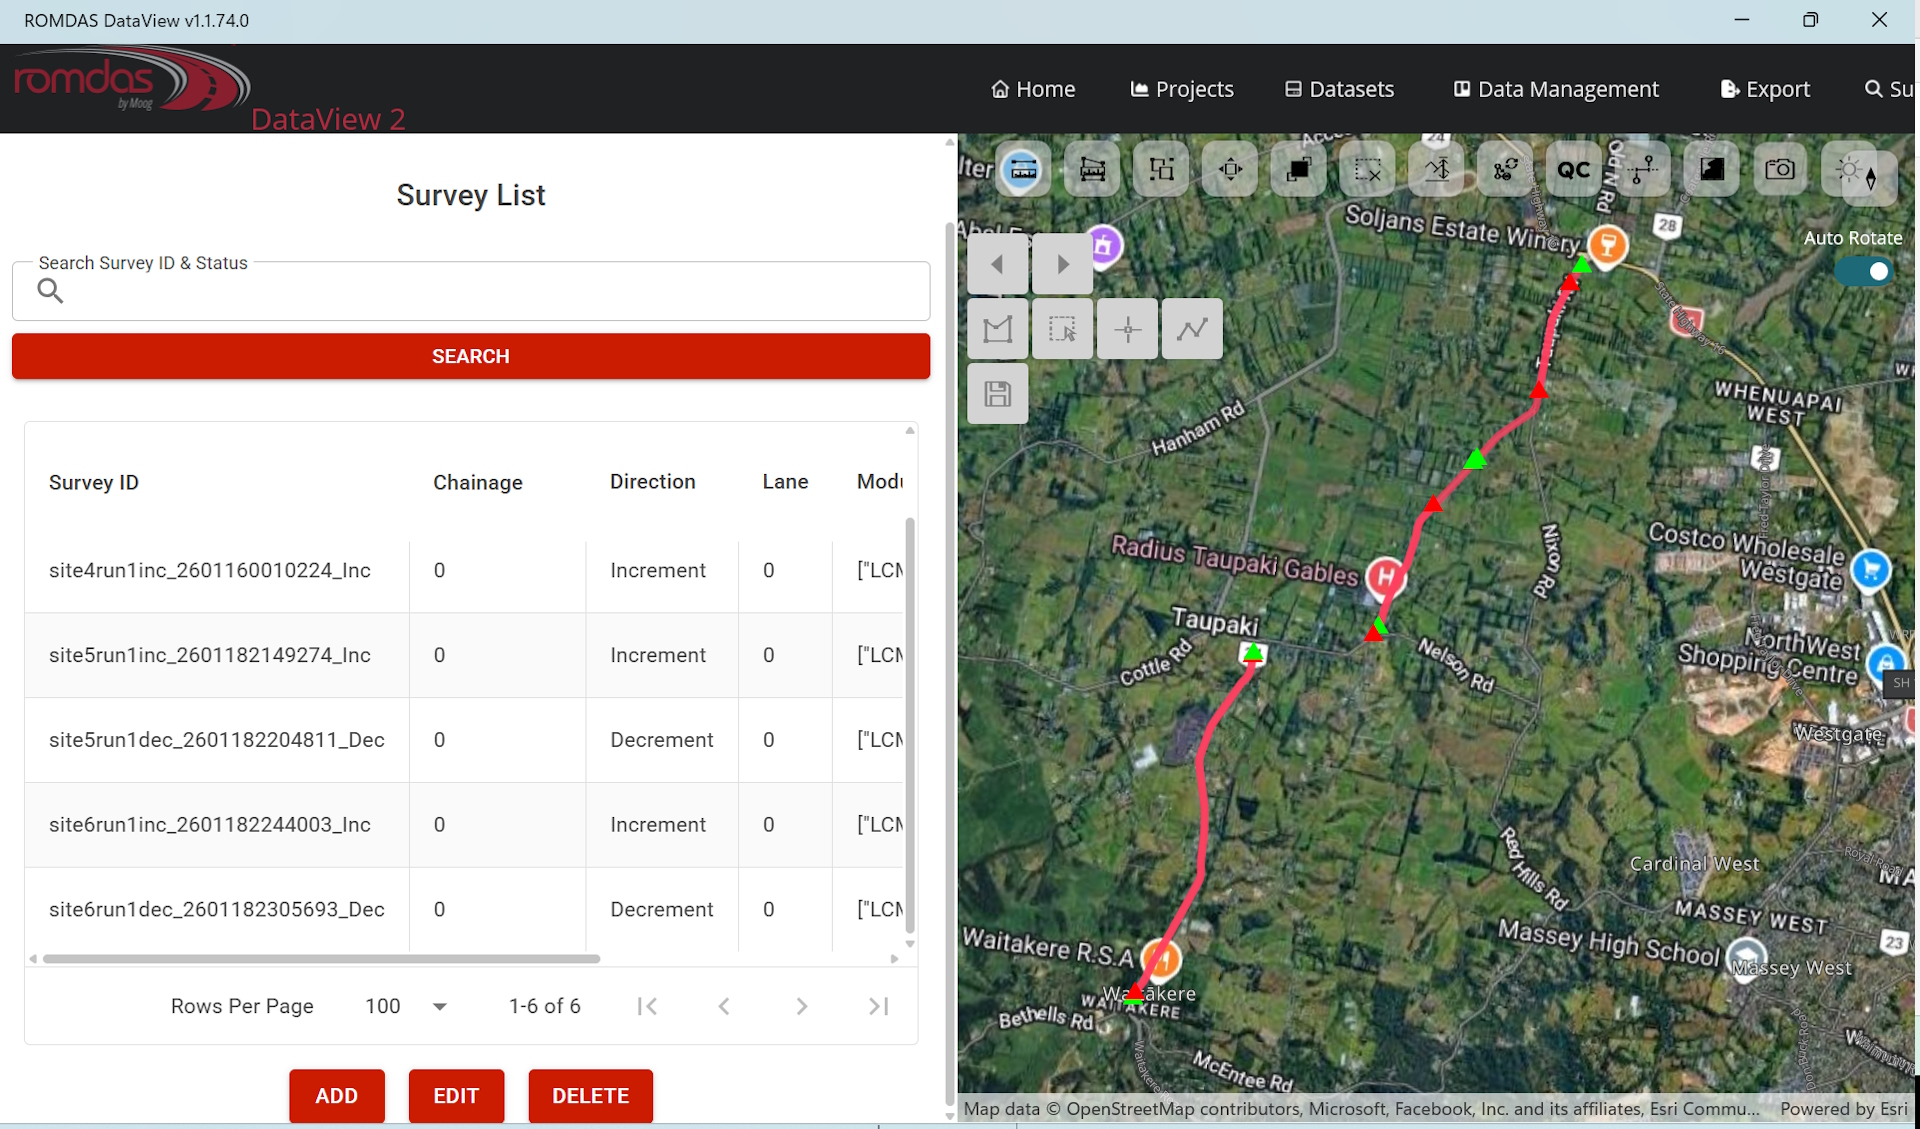
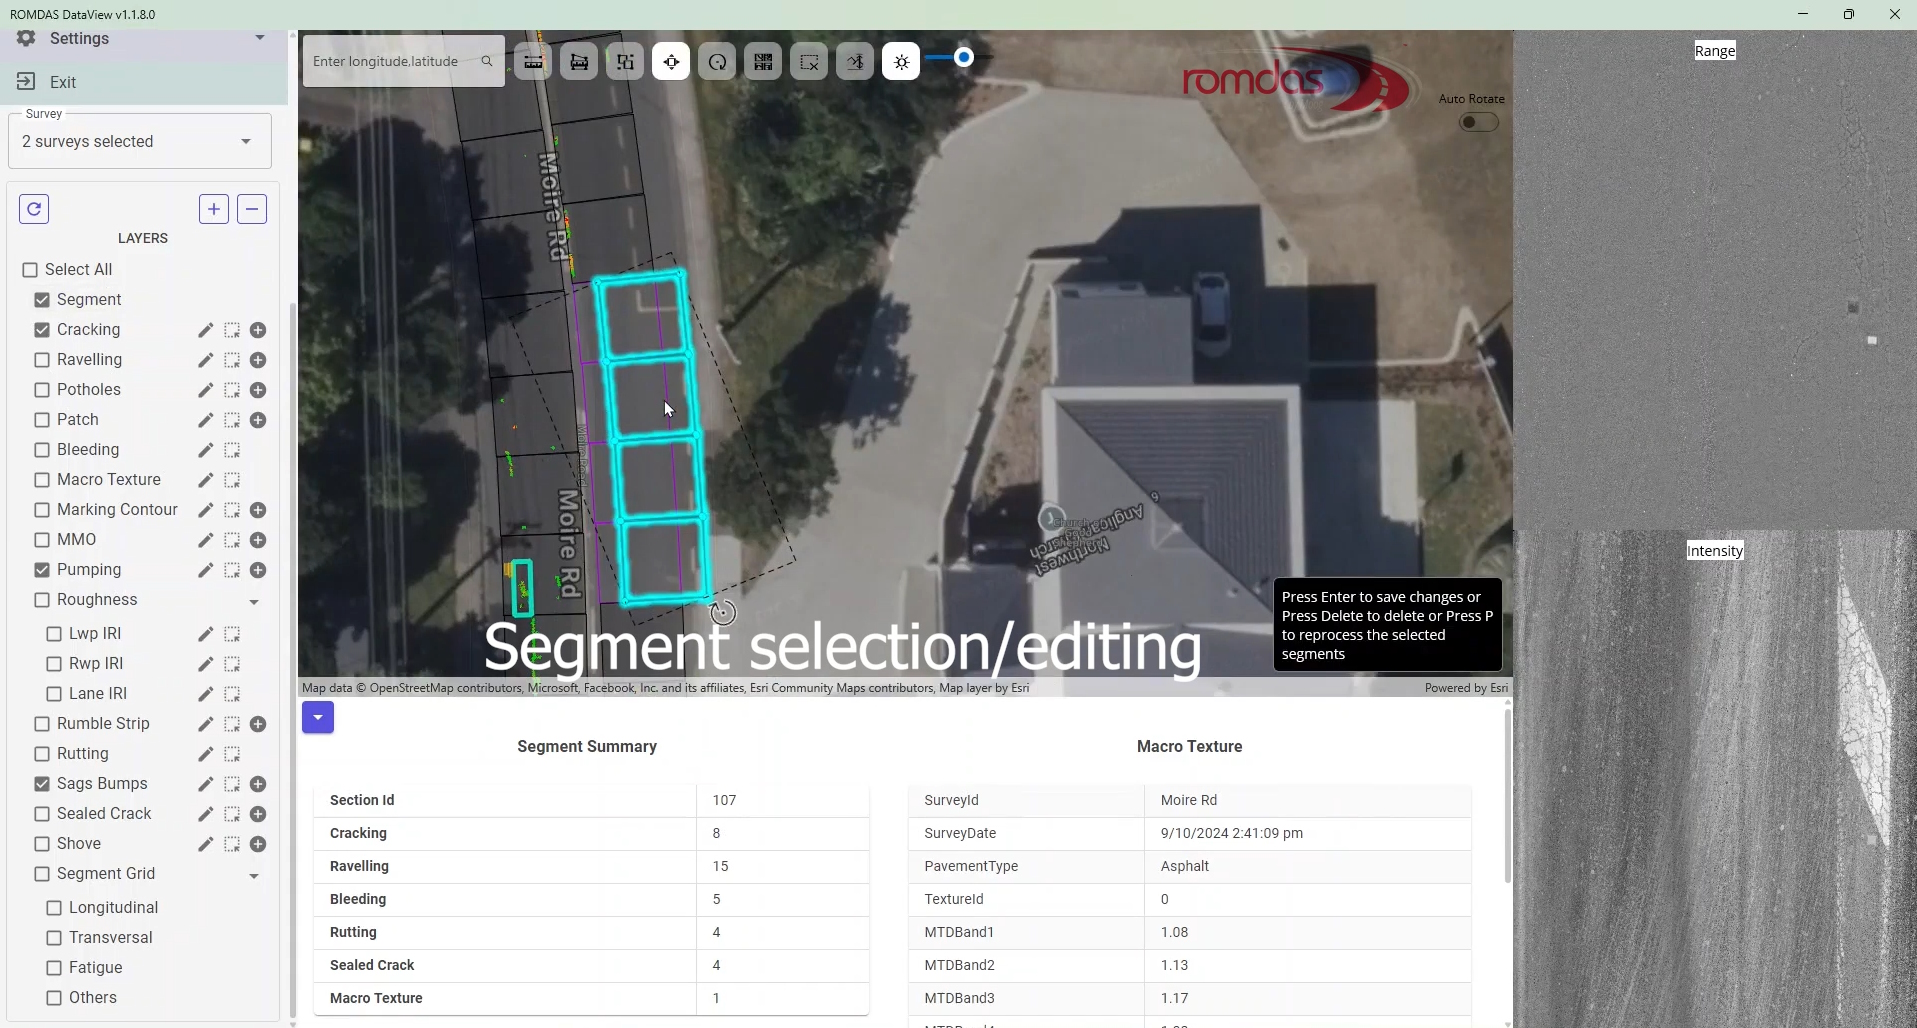
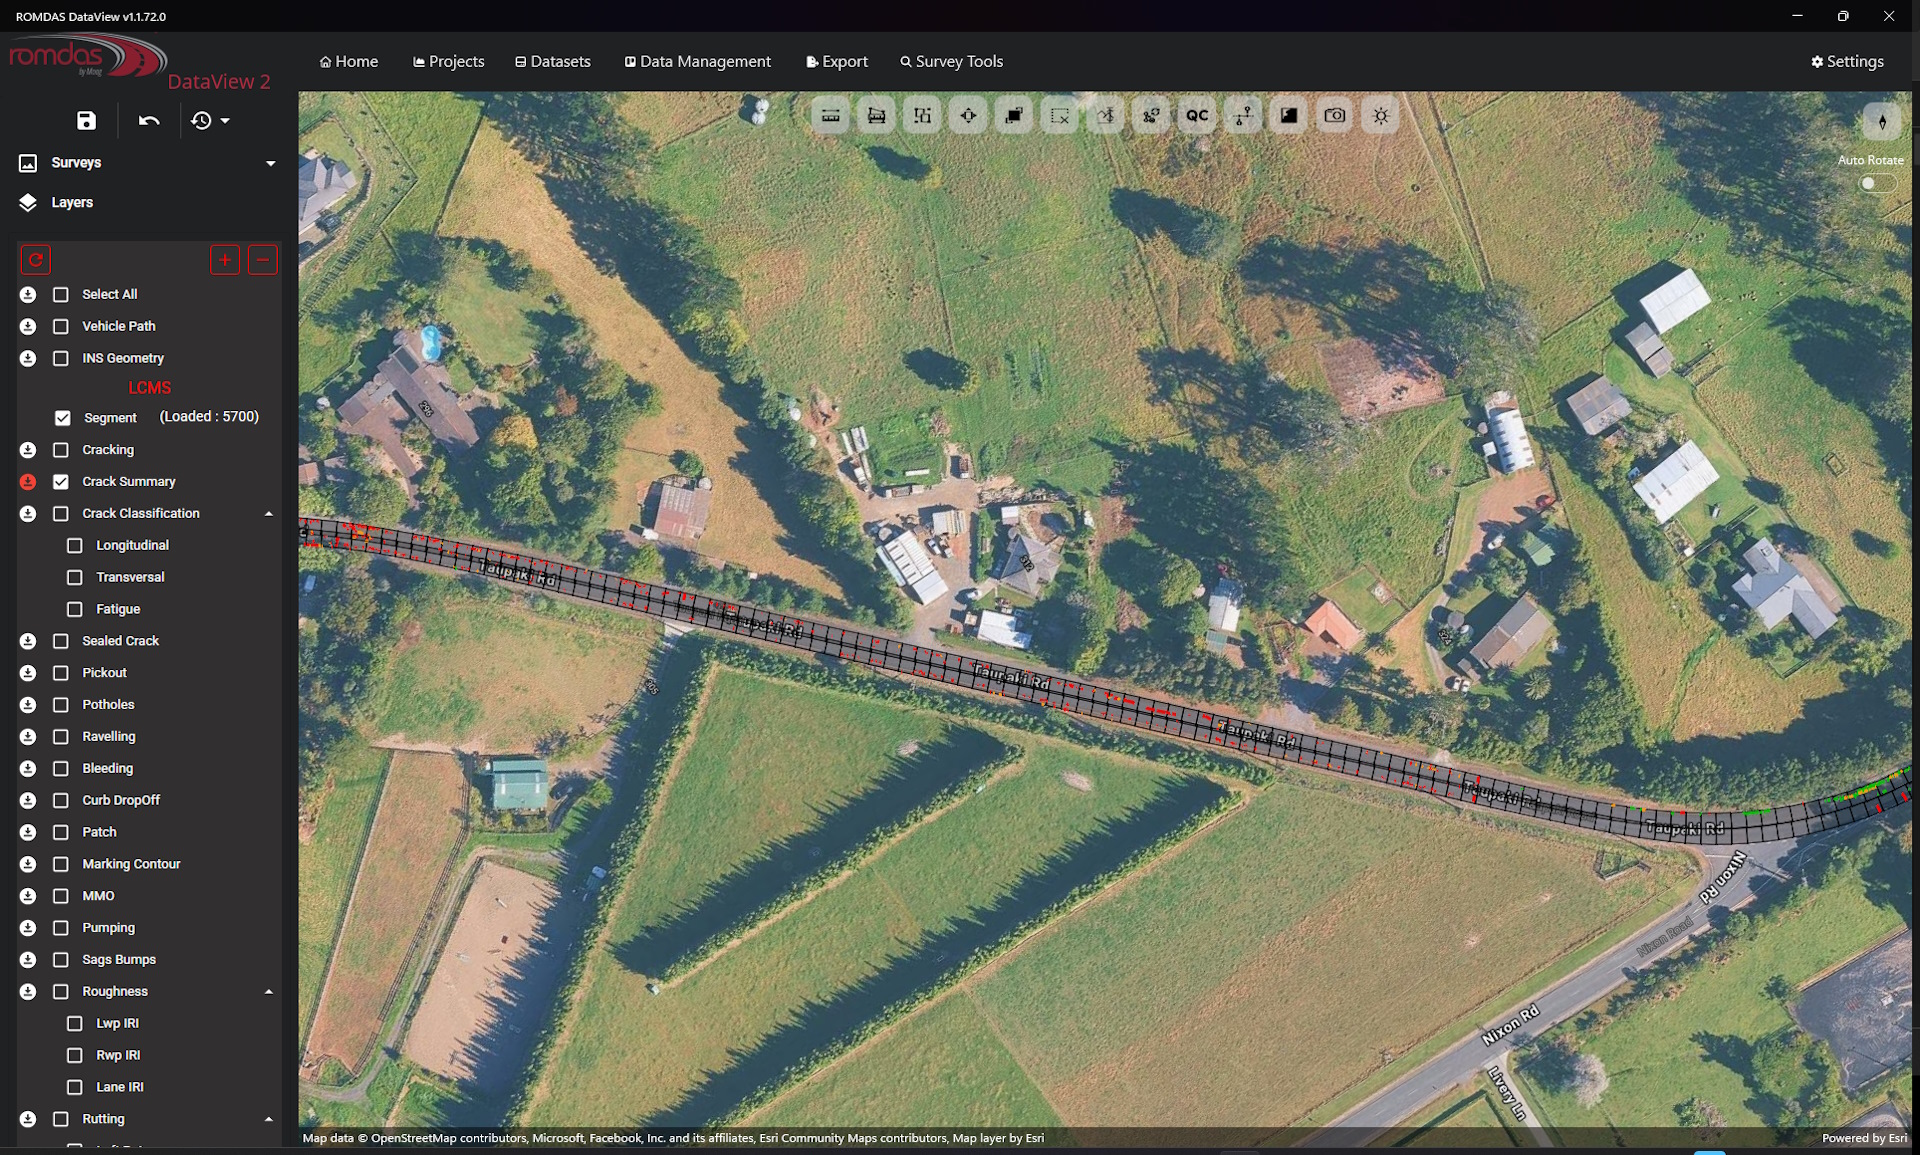
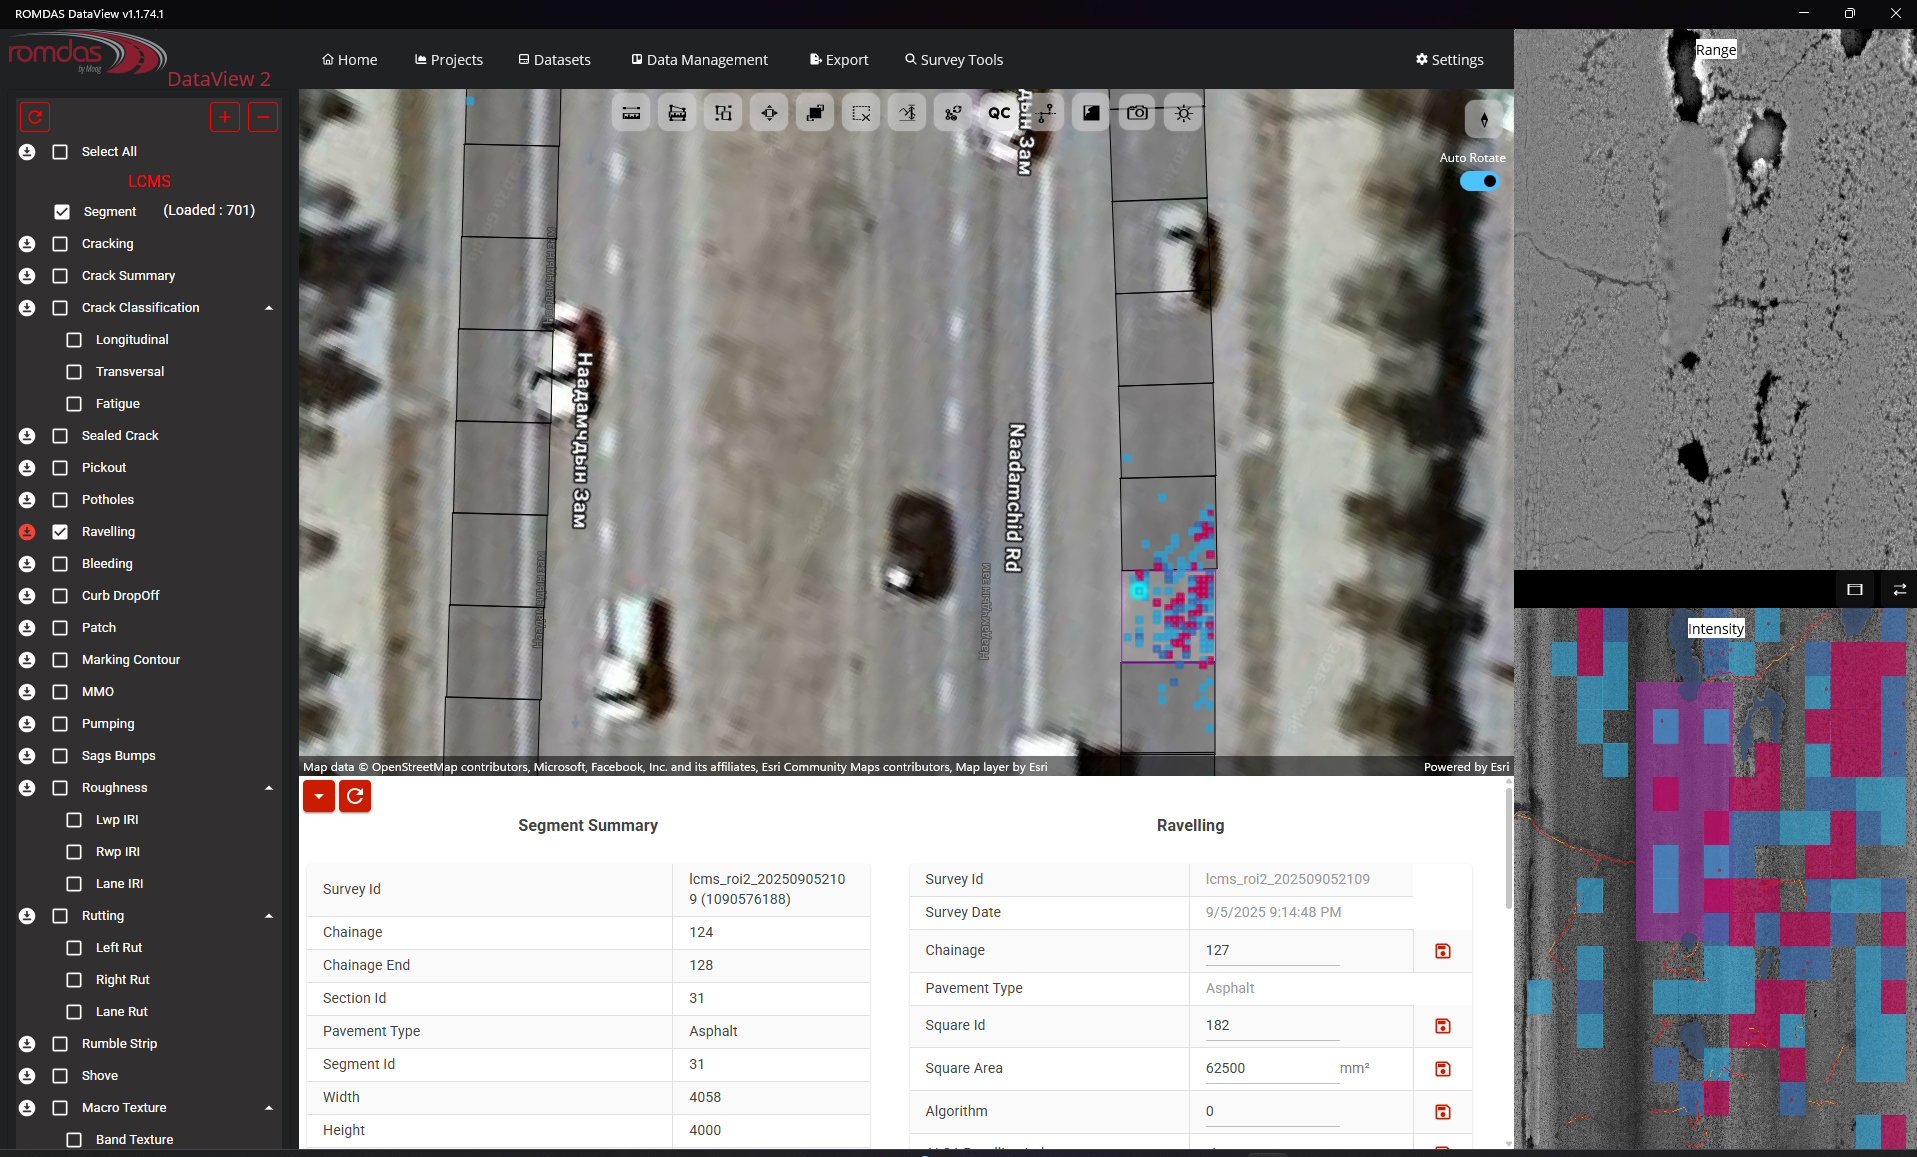
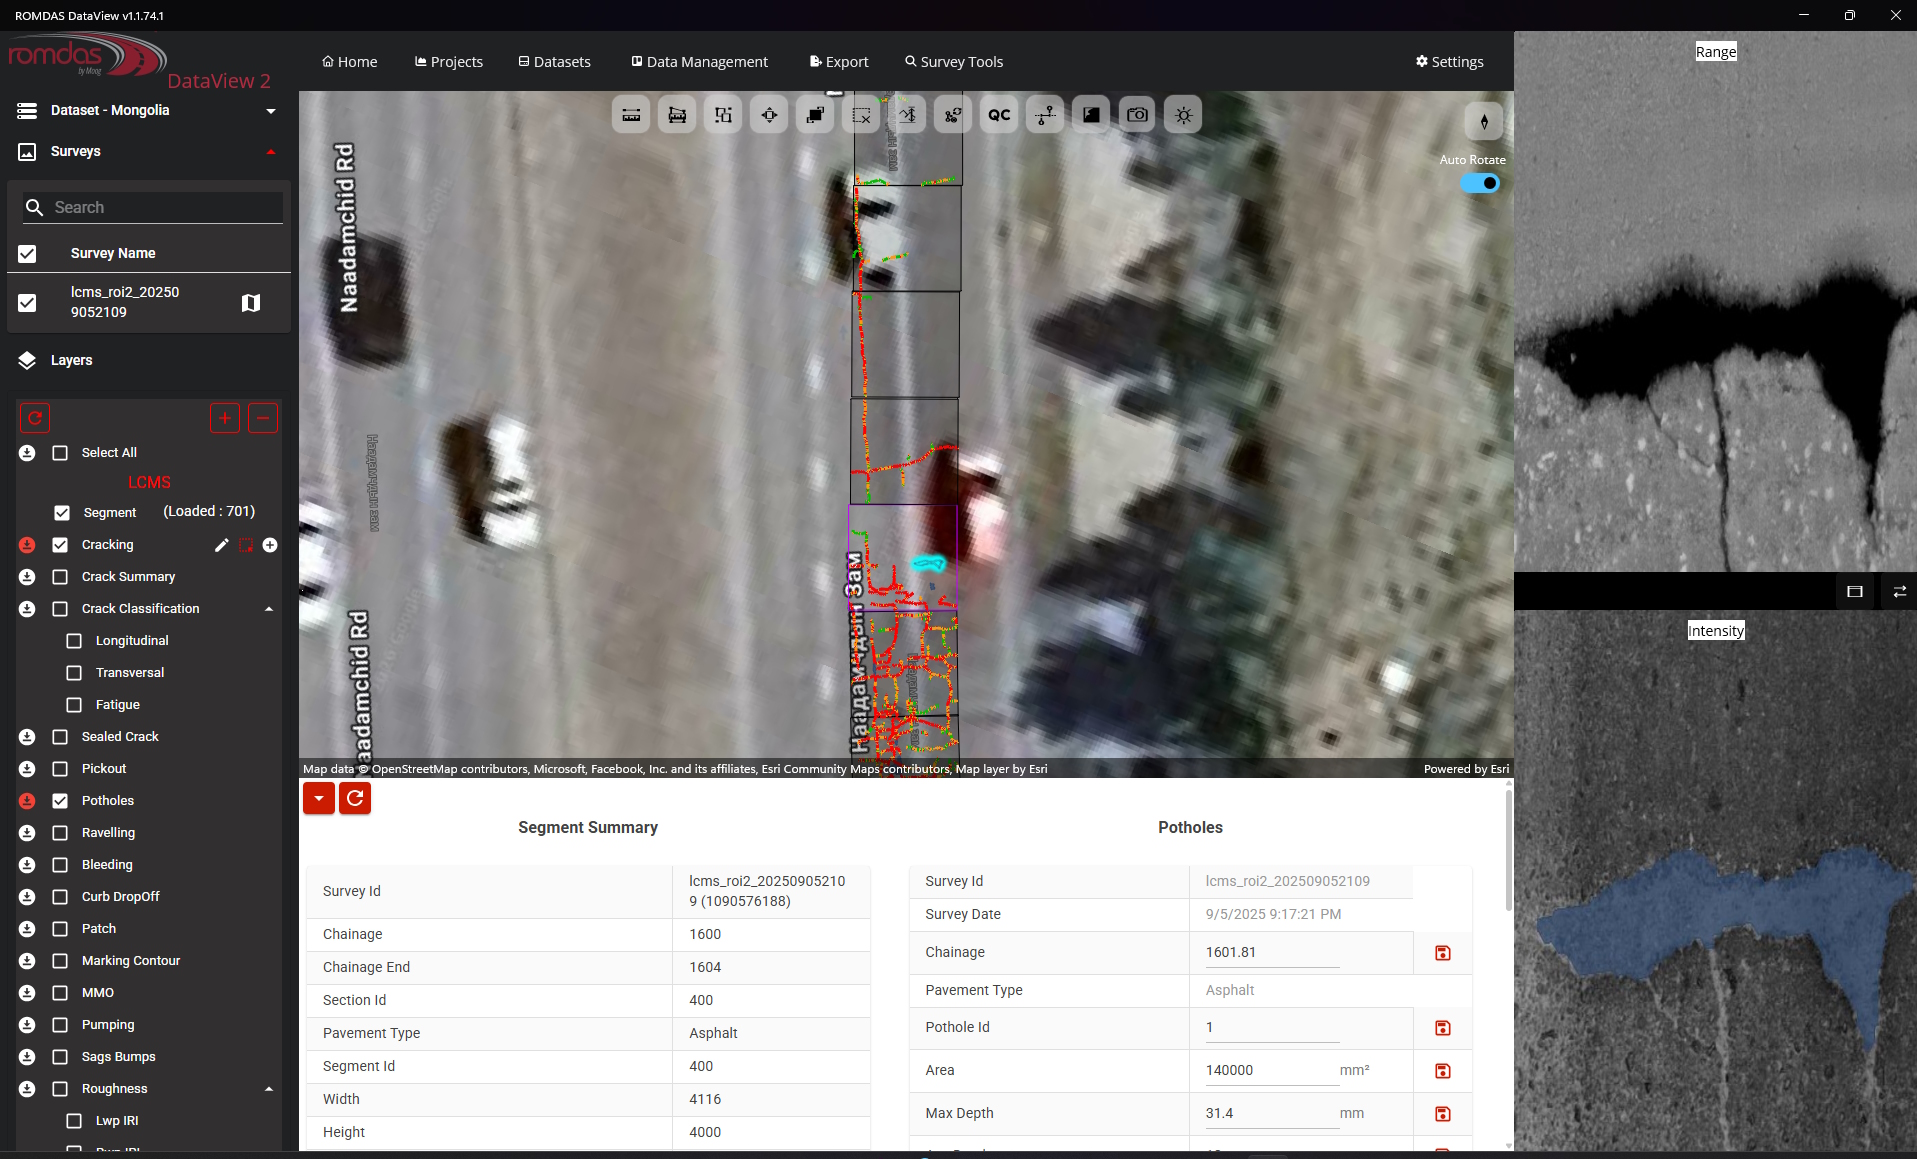
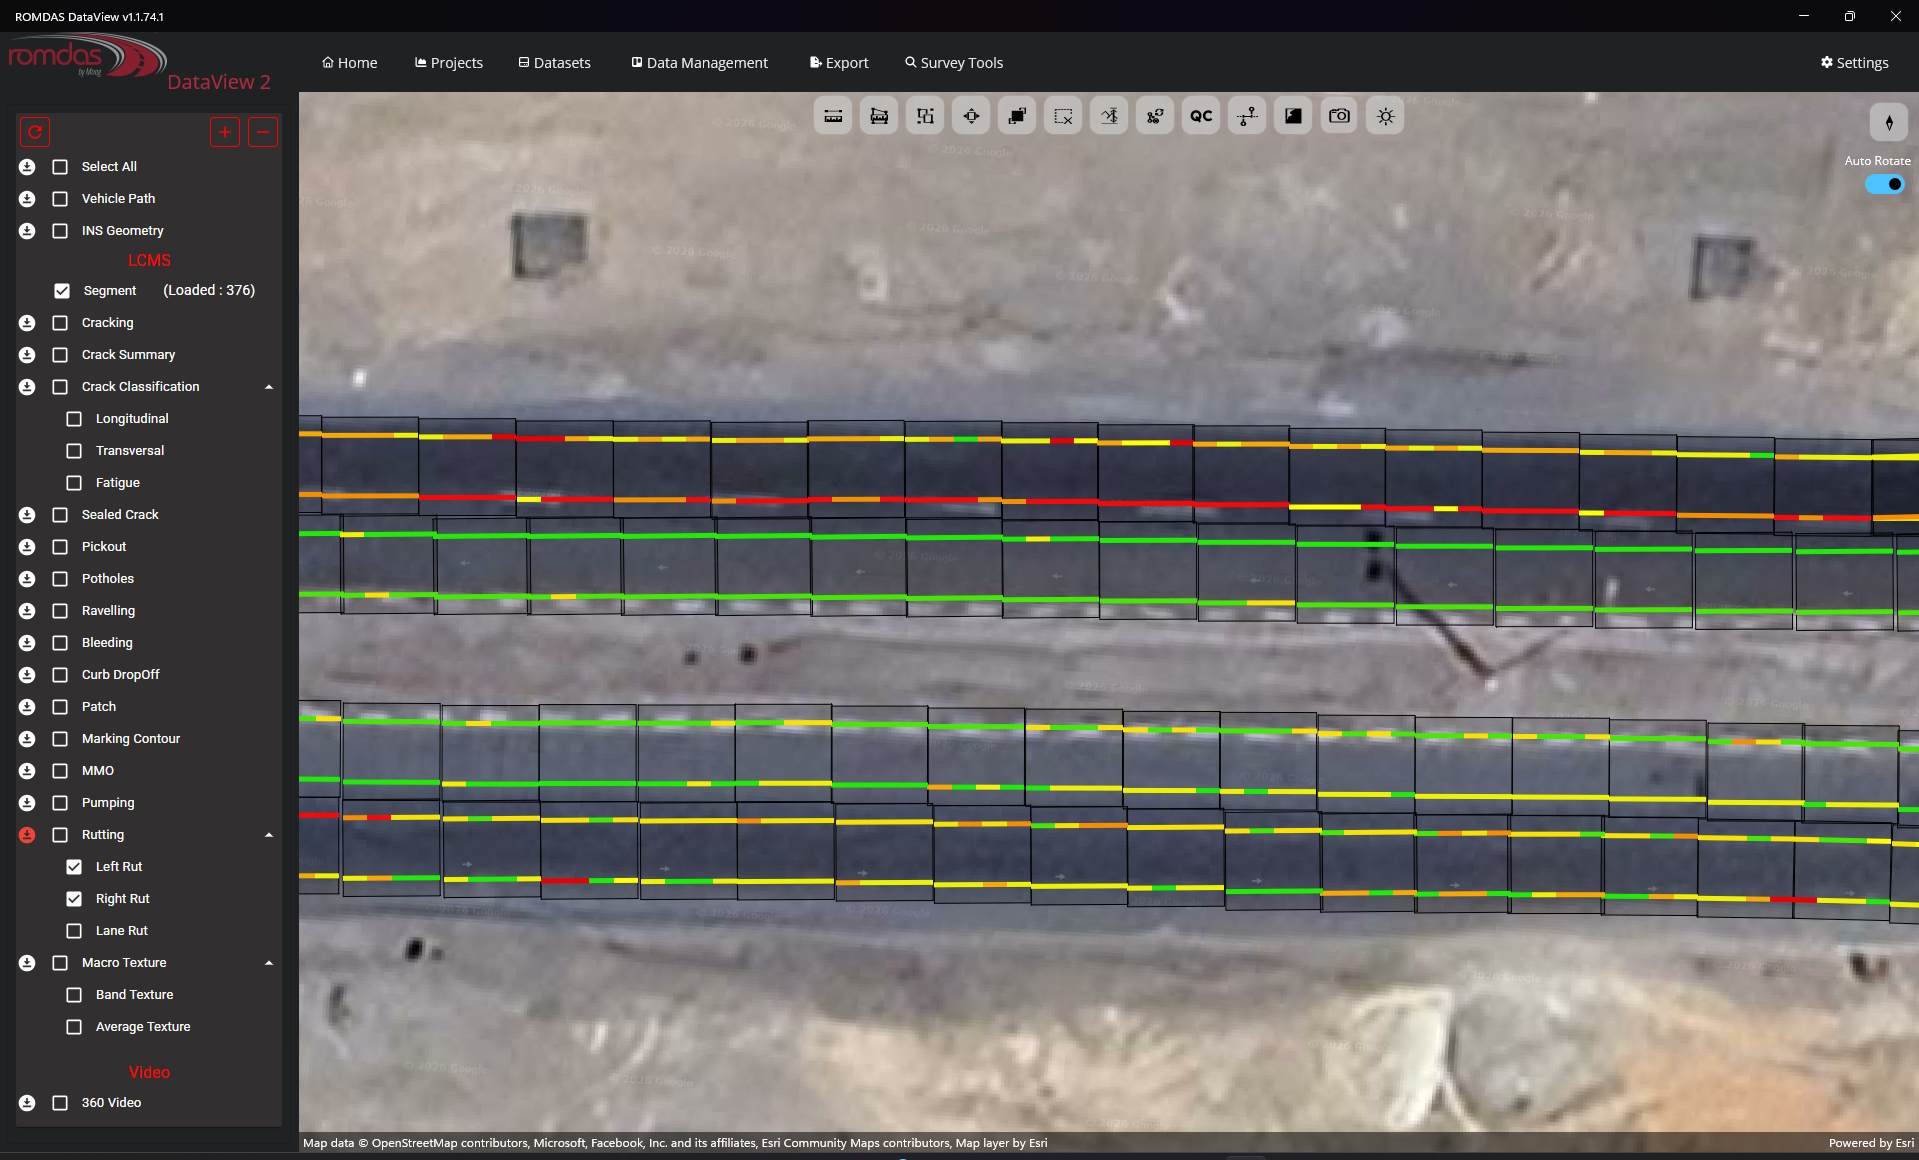
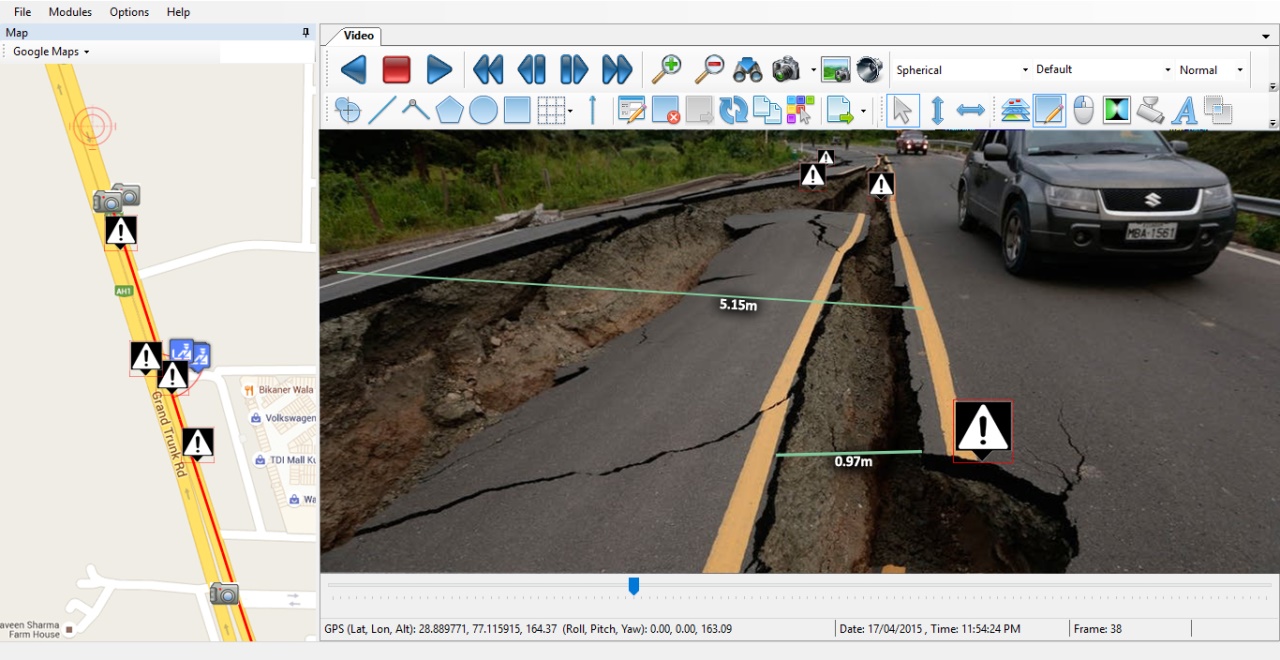
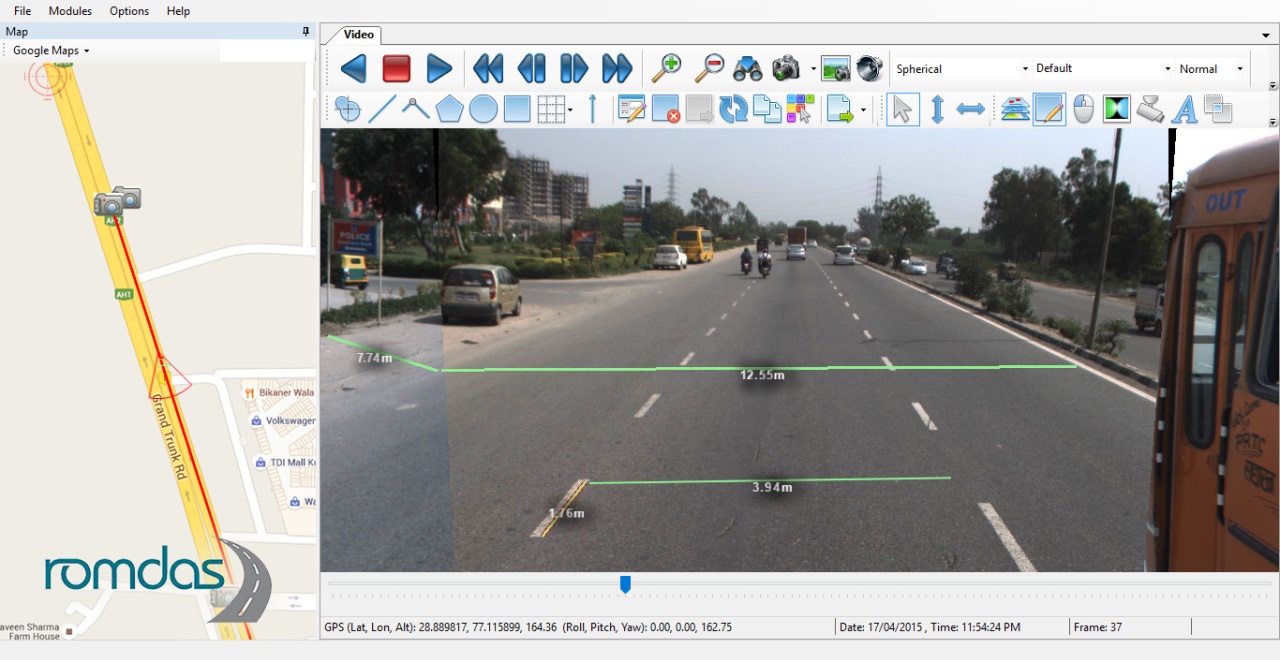
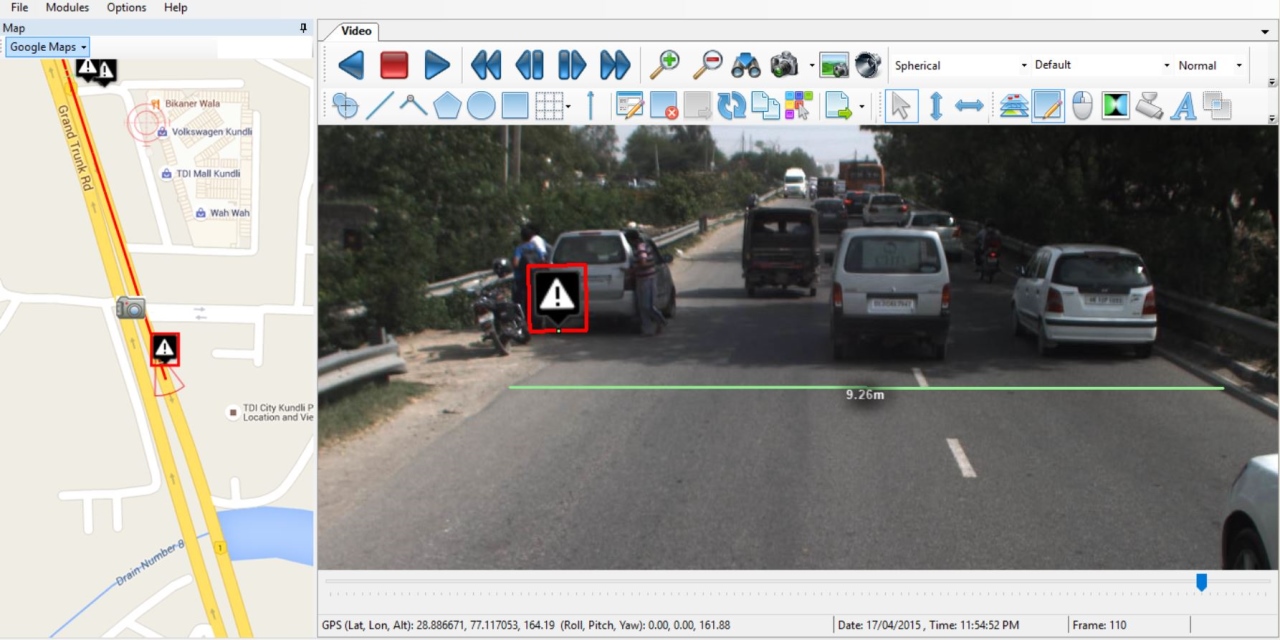
DataView 2 is a high-performance integration and post-processing platform designed to transform complex raw survey data into clear, actionable visual reports. By creating a seamless, unified workflow from the vehicle to the office, it allows engineers and survey managers to integrate individual survey files into a central database. All information is linked using precise chainage and GPS positions, enabling users to track seamlessly between collected data, GIS maps, and high-resolution imagery to create a complete digital representation of the road network.

